|
Indicator
|
EU indicator past trend
|
Selected objective to be met by 2020
|
Indicative outlook of the EU meeting the selected objective by 2020
|
|
Exceedance of air quality standards in urban areas
(nitrogen dioxide: NO2;
dust particles: PM10; fine particulate matter: PM2.5; ozone: O3)
|

NO2, PM10,
PM2.5
|

O3
|
Meet Air Quality Directive standards for the protection of human health — Air Quality Directive
|

|
|
There have been reductions in the urban population exposure to exceedances of the air quality standards for particles and nitrogen dioxide while the trend for the ozone standard is unclear. Because of their widespread exceedance levels in urban areas it is unlikely that the air quality standards for these pollutants will be met by 2020
For further information on the scoreboard methodology please see Box I.3 in the EEA Environmental indicator report 2017
|
The Seventh Environment Action Programme (7th EAP) includes the objective of ensuring that outdoor air quality in the EU will have improved significantly by 2020, moving closer to World Health Organization (WHO) guidelines. Observing the existing EU air quality legislation standards is a chief milestone in this respect. Despite some improvements, thanks to the implementation of EU legislation on emissions of air pollutants and air quality, key EU air quality standards for the protection of human health — concentrations of particulate matter (PM), ozone (O3) and nitrogen dioxide (NO2) — are currently not being met in various air quality monitoring stations in the EU. This is particularly true for urban areas, where more than 70 % of the EU population lives. This can be mainly attributed to the high level of emissions from road traffic and residential combustion in urban areas and unfavourable conditions for the dispersion of emissions due to topography and meteorological issues. Because of their widespread exceedances in urban areas, it is unlikely that the air quality standards for these pollutants will be met by 2020, while achieving air quality in line with the WHO guidelines is much further away. It should be noted that in 2015 compared with 2014 there has been more urban population exposed to exceedances of the air quality standards for ozone, nitrogen dioxides and dust particles. Further action will be needed, in particular in relation to road traffic and residential combustion in urban areas.
Setting the scene
The 7th EAP (EU, 2013) aims to significantly improve outdoor air quality and move closer to World Health Organization (WHO) guidelines (WHO, 2006) by 2020. Air pollution is the number one environmental cause of death in the EU, responsible for more than 400 000 premature deaths per year (EEA, 2017a). According to WHO studies (WHO, 2013, 2014), exposure to particulate matter (PM) can cause or aggravate cardiovascular and lung diseases, heart attacks and arrhythmias, affect the central nervous system and the reproductive system and cause cancer. Exposure to high ozone (O3) concentrations can cause breathing problems, trigger asthma, reduce lung function and cause lung diseases. Exposure to nitrogen dioxide (NO2) increases symptoms of bronchitis in asthmatic children and reduces lung function growth. Health-related external costs range from EUR 330 billion to EUR 940 billion per year, depending on the valuation methodology, with evidence on the impacts of chronic ozone exposure adding around 5 % to this total (EC, 2013).
Policy targets and progress
A chief cornerstone of the EU environmental acquis in the field of air quality is the Air Quality Directive (EU, 2008). This directive sets a number of air quality standards not to be exceeded by a certain year and thereafter.
The communication on the ‘Clean Air Programme for Europe’ (EC, 2013) sets the short-term objective of achieving full compliance with existing legislation by 2020 at the latest, as well as the long-term objective of seeing no exceedances of the WHO guideline levels for human health. The most troublesome pollutants in terms of harm to human health are particulate matter (PM), nitrogen dioxide (NO2) and ground-level ozone (O3) (EEA, 2016). The European air quality standards and the WHO air quality guidelines (WHO, 2006) for these pollutants are displayed in Table 1.
Table 1. Air quality standards, under the EU Air Quality Directive, and WHO air quality guidelines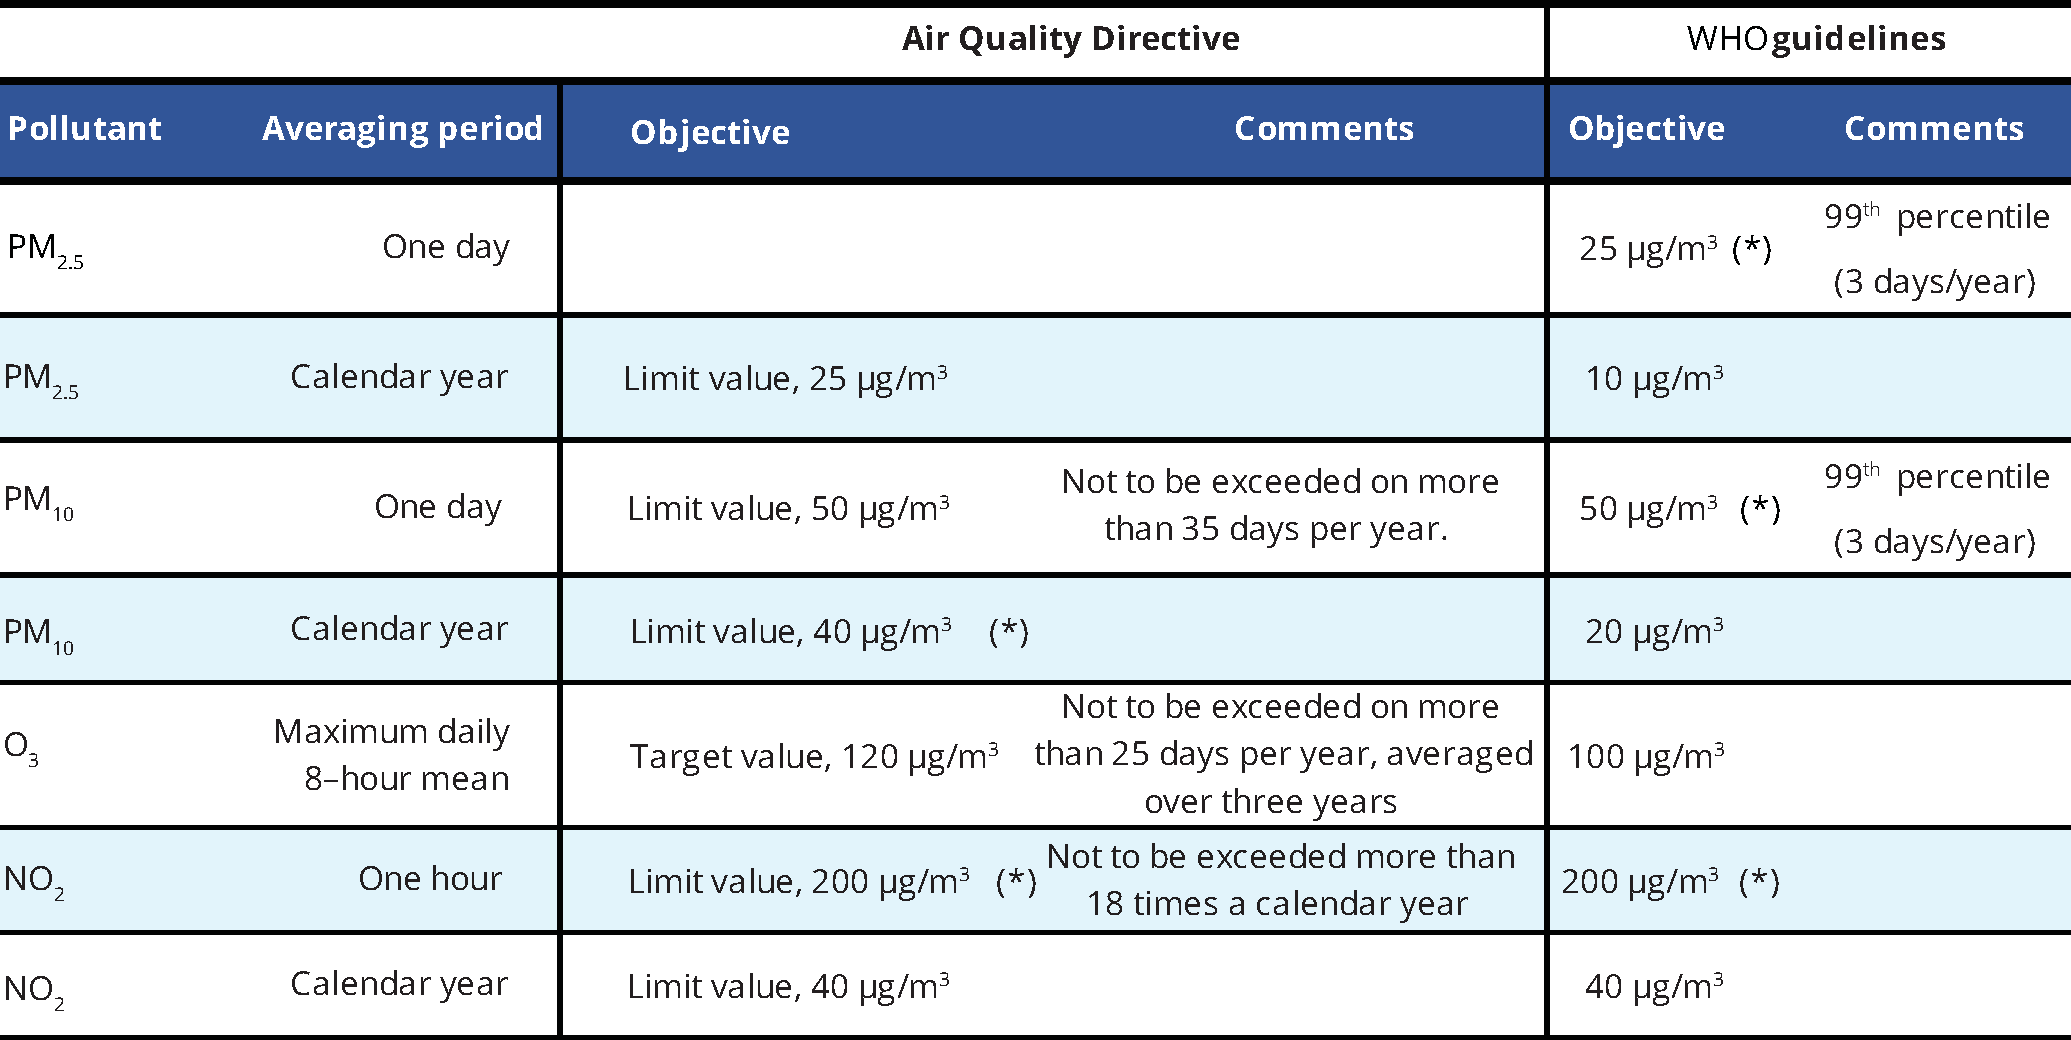
Source: EU, 2008; WHO, 2006.
Note: 1. (*) Not considered in the indicator, where only the most stringent EU standards are used: the daily limit value for PM10 and the annual limit value for NO2. According to the WHO air quality guidelines, the annual average for PM takes precedence over the 24-hour average, since, at low levels, there is less concern about episodic excursions.
2. In line with the Air Quality Directive: ‘limit value’ shall mean a level fixed on the basis of scientific knowledge, with the aim of avoiding, preventing or reducing harmful effects on human health and/or the environment as a whole, to be attained within a given period and not to be exceeded once attained; ‘target value’ shall mean a level fixed with the aim of avoiding, preventing or reducing harmful effects on human health and/or the environment as a whole, to be attained where possible over a given period.
Figures 1 and 2 show the percentage of the urban population exposed to air pollutant concentrations above both EU standards (Figure 1) and WHO guidelines (Figure 2).
Note:
The rationale for selection of pollutants and corresponding selected air quality standards is given in the specification section of indicator CSI004.
Criteria:
- Percentage of the population exposed to annual PM2.5 concentrations above 25 µg/m3.
- Percentage of the population exposed to daily PM10 concentrations exceeding 50 µg/m3 for more than 35 days a year.
- Percentage of the population exposed to maximum daily 8-hour mean O3 concentrations exceeding 120 µg/m3 for more than 25 days a year.
- Percentage of the population exposed to annual NO2 concentrations above 40 µg/m3.
Note:
The rational for selection of pollutants and corresponding WHO guidelines is given in the specification section of indicator CSI 004.
Criteria:
- Percentage of population exposed to annual PM2.5 concentrations above 10 µg/m3.
- Percentage of population exposed to annual PM10 concentrations above 20 µg/m3.
- Percentage of population exposed to maximum daily 8-hour mean O3 concentrations exceeding 100 µg/m3 for at least one day a year.
- Percentage of population exposed to annual NO2 concentrations above 40 µg/m3.
Around one quarter of Europeans currently living in urban areas are exposed to air pollutant levels exceeding some EU air quality standards. Moreover, up to 96 % are exposed to levels of some air pollutants deemed damaging to health by the WHO’s more stringent guidelines (EEA, 2017b).
Particulate matter (PM)
Between 2006 and 2015, 8–16 % of the EU’s urban population is estimated to have been exposed to concentrations of fine particulate matter (PM2.5) in excess of the EU limit value set for the protection of human health[1] (Figure 1). With respect to the more stringent WHO guideline value (Figure 2), a much larger proportion of the urban population (82–97 %) was exposed to concentrations above this threshold.
Notwithstanding limitations in data coverage in the early 2000s, a significant proportion of the EU urban population (16–43 %) was exposed to concentrations of coarse dust particles (PM10) in excess of the EU daily limit value set for the protection of human health during the 2000–2015 period (Figure 1). A slightly decreasing tendency can be observed throughout the whole period.
For the more stringent WHO guideline value (Figure 2), a higher proportion of the urban population (50–92 %) was exposed to concentrations above this threshold. Here, a decreasing tendency is also observed, as in the case of the EU limit value.
PM may be categorised as either primary (i.e. directly emitted to the atmosphere) or secondary (i.e. formed in the atmosphere from the so-called precursor gases).
Primary PM originates from both natural and anthropogenic sources. The main emitter sector is ‘commercial, institutional and household fuel combustion’. For PM10 ‘industry’ and ‘agriculture’ are listed in second and third place; and for PM2.5 ‘transport’ and ‘industry’. All these sectors reduced their PM emissions in the EU in the 2000–2015 period, although higher relative reductions were observed for industry and transport and only small reductions were observed for the other two sectors.
With the exception of ammonia, in the EU, reductions in emissions of the other secondary PM precursors (nitrogen oxides, sulphur oxides, and non-methane volatile organic compounds) were much larger than those in emissions of primary PM from 2000 to 2015.
However, the reductions in both primary PM and precursors have not led to equivalent drops in the concentrations of PM. This is because chemical reactions of the precursors form secondary particles, and therefore the relationships between emissions and concentrations are not linear. It can also be explained by uncertainties in the reported emissions of primary PM from the ‘commercial, institutional and household fuel combustion’ sector, by intercontinental transport of PM and its precursor gases from outside Europe, and by the contribution of natural sources to PM concentrations (EEA, 2016).
The contributions of the different emission sources to ambient air concentrations depend not only on the amount of pollutant emitted, but also on proximity to source, emission conditions (such as height and temperature) and other factors, such as dispersion conditions and topography. Sectors with low emission heights, such as traffic and household fuel combustion, generally make a more significant contribution to surface concentrations than emissions from high stacks.
Ozone (O3)
Although reductions in European emissions of O3 precursors have led to lower peak concentrations of O3, the current target value is frequently exceeded. In the 2000–2015 period, between 8 % (in 2014) and 55 % (in 2003) of the urban population was exposed to concentrations above the target value (Figure 1).
In relation to the more stringent WHO guideline (Figure 2), the proportion of the population exposed to concentrations above the guideline value is as high as 94–99 %, with no discernible change over time.
O3 concentrations are determined by emissions of its precursors and by meteorological conditions: ozone is formed in sunny conditions with high temperatures. Apart from reductions in anthropogenic emissions of O3 precursors, there have been increases in natural emissions and also in the intercontinental transport of O3 and its precursors (Maas and Grennfelt, 2016). Additional factors that are also likely to mask the effects of European measures to reduce anthropogenic emissions of O3 precursors include climate change, emissions of non-methane volatile organic compounds from vegetation (difficult to quantify) and fire plumes from forest and other biomass fires (EEA, 2010). Formation of tropospheric ozone from increased concentrations of methane may also contribute to the sustained O3 levels in Europe.
Nitrogen dioxide (NO2)
Between 2000 and 2015, the fraction of the urban population exposed to concentrations in excess of the EU limit value and the identical WHO guideline value gradually decreased to around 10 %, with a minimum of 7 % in 2014 (Figures 1 and 2). At 31 %, the highest exposure of the urban population to NO2 occurred in 2003.
Enforcement of current legislation has resulted in a reduction in NOx emissions in all sectors. Nevertheless, emissions from transport keep NO2 concentrations high close to main roads.
Based on the current trends explained above, and because of their widespread exceedances in urban areas, it is unlikely that air quality standards for these pollutants will be met by 2020, while achieving air quality in line with the WHO guidelines is much further away (except for NO2 for which both EU standard and WHO guideline are the same). Effective air quality policies require action and cooperation on global, European, national and local levels, which must reach across most economic sectors and engage the public. Holistic solutions must be found that involve technological development, structural changes — including the optimisation of infrastructures and urban planning — and behavioural changes. These will be necessary to deliver a level of air quality across the EU that is conducive to the protection of human health (EEA, 2016).
Country level information
Table 2 provides information on the urban population exposed to concentrations of air pollutants above the EU air quality objectives by country for the year 2015. Variations from country to country are not only related to the different pollutant concentrations but also to:
- the number of available data series (monitoring stations and/or selected cities), which will influence the total monitored population;
- the uneven distribution of traffic and background stations in the different countries.
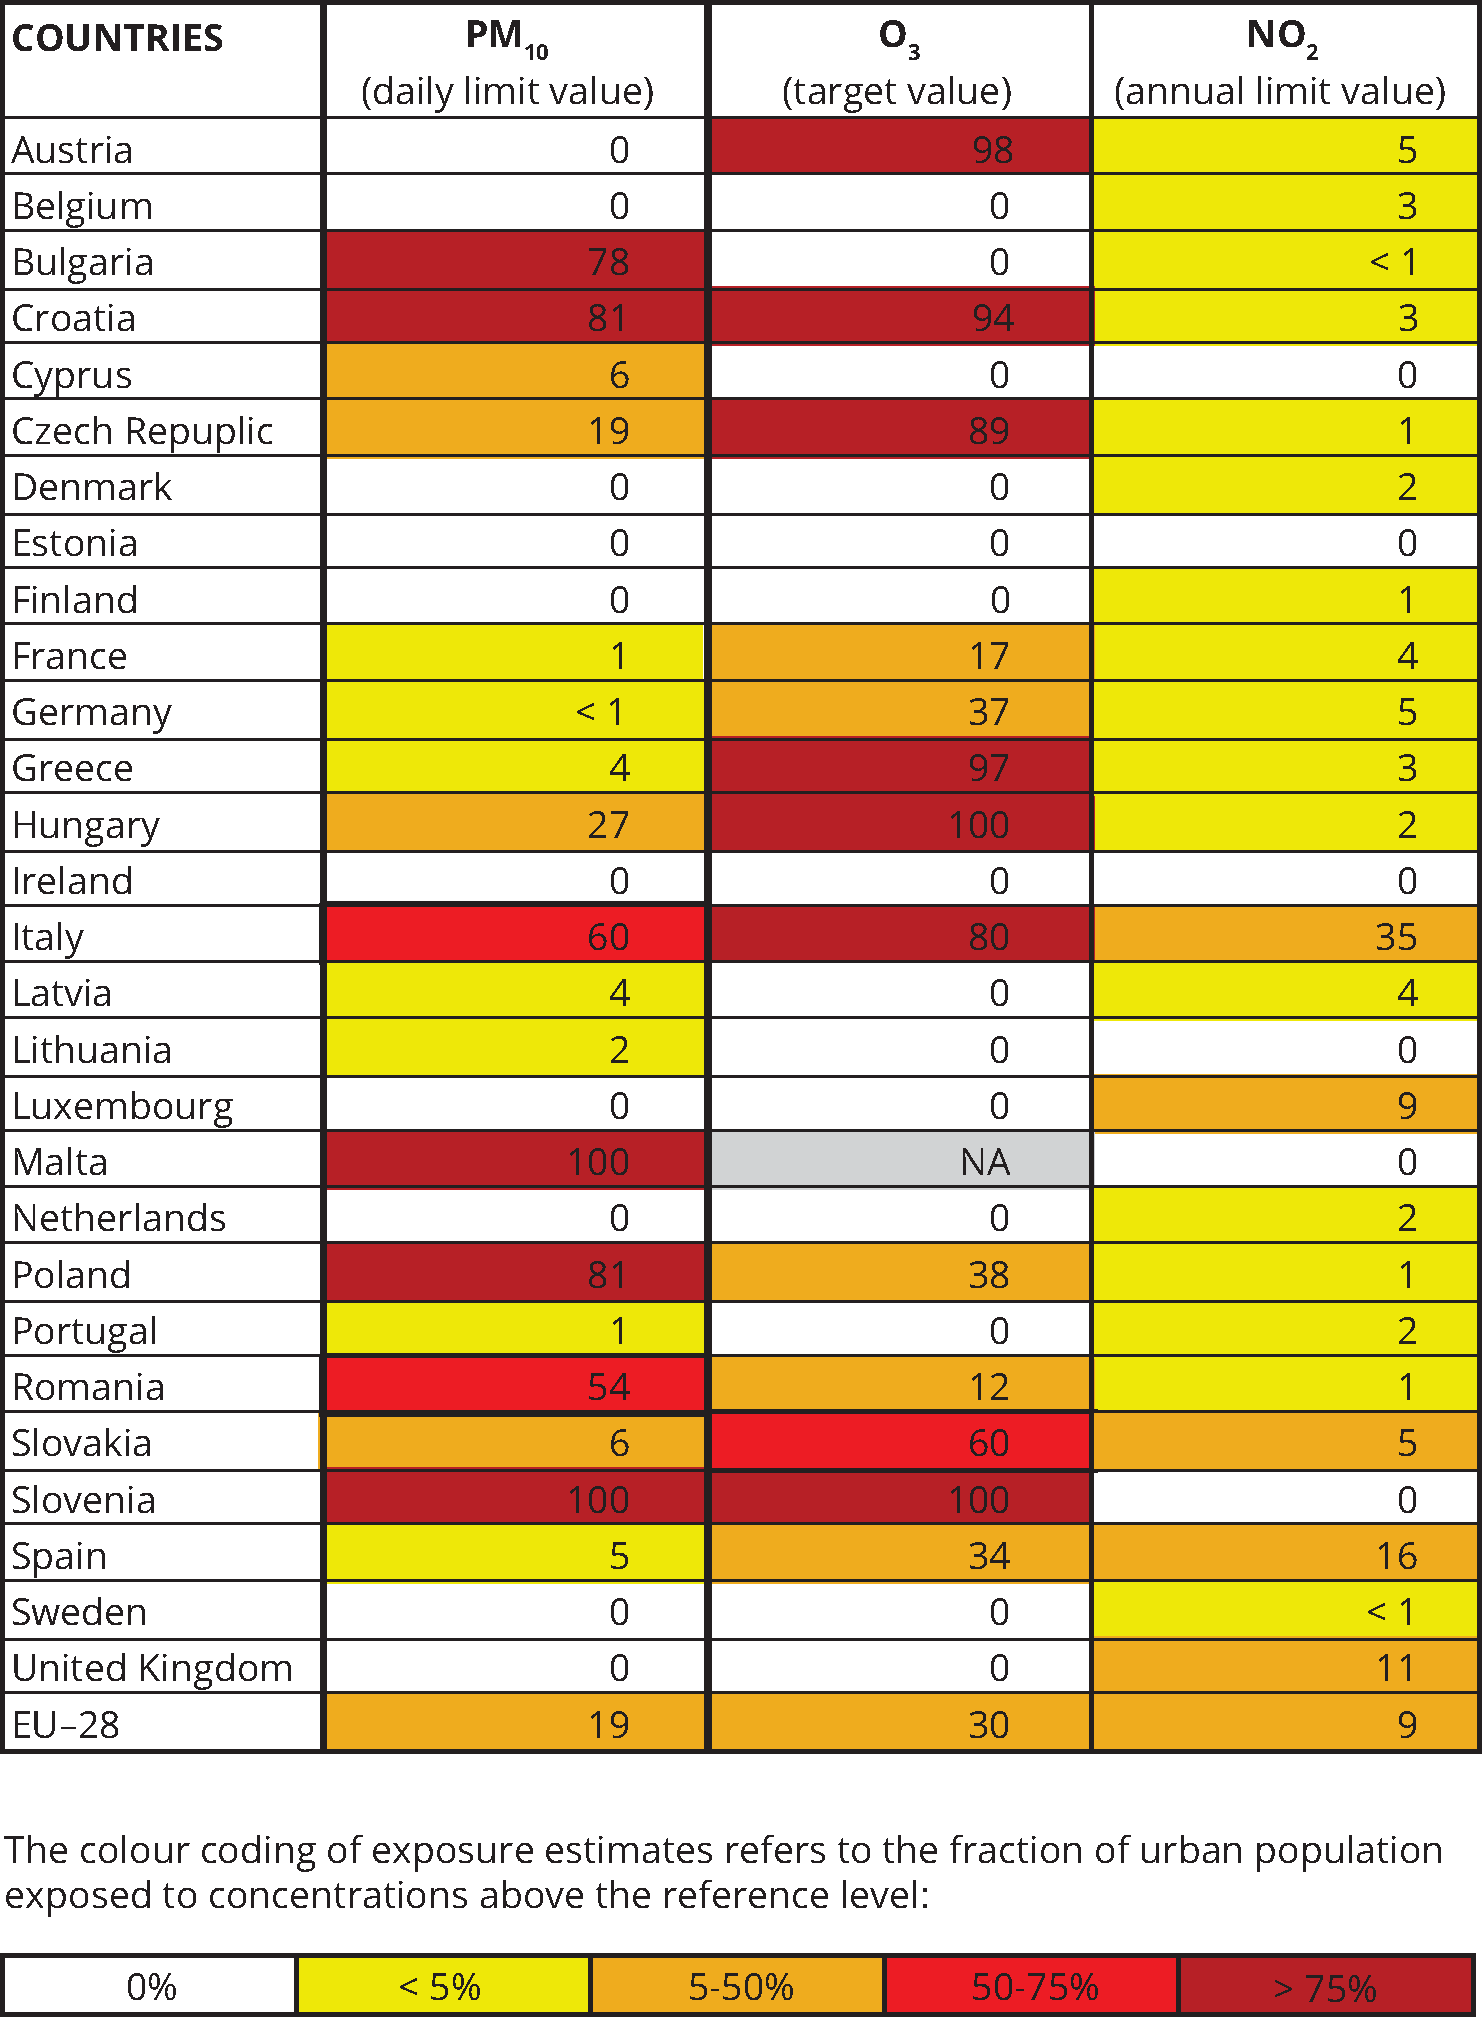
Note: NA = no available data, for further information please see indicator CSI004.
Source: Air pollution country fact sheets (EEA, 2014) updated with 2015 data. The 2015 data aggregated at EU level are also available in (EEA, 2017a, 2017c).
Outlook beyond 2020
In 2013, the European Commission proposed a Clean Air Policy Package for Europe (EC, 2013), which aims to achieve full compliance with existing air quality legislation by 2020 and to further improve Europe’s air quality by 2030 and beyond. As a result of this package, the 2001 National Emission Ceilings Directive (EU, 2001) was reviewed. The new National Emission Ceilings Directive (EU, 2016) establishes national emission reduction commitments applicable from 2020 and stricter commitments from 2030 for sulphur dioxide, nitrogen oxides, non-methane volatile organic compounds, ammonia and PM2.5. In addition, and as part of the package, a new directive, the Medium Combustion Plant Directive, was approved in November 2015 (EU, 2015). This directive regulates sulphur dioxide, nitrogen oxides and dust emissions from the combustion of fuels in medium-sized combustion plants (with a rated thermal input of 1 and up to 50 megawatts).
These new commitments, together with the on-going implementation of air quality improvement measures at national, regional and local levels, are expected to improve air quality in Europe. However, the changes in meteorological conditions due to climate change are expected to increase O3 concentrations as a result of expected increased emissions of both specific O3 precursors and emissions from wildfires, with the latter likely to increase under periods of extensive drought (EEA, 2015).
Finally, it is expected that the age group composition of the EU population will continue to shift towards higher numbers of the elderly because of continuing increases in life expectancy (Eurostat, 2016). The overall potential air pollution-related health impact of this change remains uncertain.
About the indicator
This indicator shows the proportion of the EU urban population that is exposed to various potentially harmful concentrations of pollutants in excess of both EU standards and WHO guidelines set for the protection of human health. For further information on the methodology, please refer to the EEA indicator CSI004 ‘Exceedance of air quality standards in urban areas (EEA, 2017b).
The indicator focuses on those pollutants that are most relevant in terms of health effects and urban concentrations: PM, both PM10 and fine PM, i.e. PM2.5; O3; and NO2. When there is more than one standard, only the most stringent one is used. The indicator is based on measurements of air pollutants reported under the Air Quality Directive (EU, 2008) and the Decision on the exchange of information (EU, 2011).
Most air pollution is man-made and derives from the combustion of fossil or biomass fuels used in industry, transport and heating; industrial and agricultural processes; and other sources (EEA, 2017a). As most of these sources, particularly emissions from cars, are concentrated in urban areas where most of the European population lives, air quality in urban areas is a useful proxy for tracking progress towards meeting the standards set out in the Air Quality Directive.
References
[1] Please note that this year’s scoreboard assessed the past trend for fine particulate matter exceedances (2006-2015) as an improving trend, i.e. it was depicted by a green triangle. Last year’s scoreboard assessed the past trend (2006-2014) as unclear, i.e. it was depicted by a yellow triangle. This is because this year with an additional year of data the time series was considered by the experts sufficiently long to judge the past trend and to therefore conclude that it was improving.
EC, 2013, Communication from the Commission to the Council, the European Parliament, the European Economic and Social Committee and the Committee of the Regions ‘A Clean Air Programme for Europe’ (COM(2013) 918 final).
EEA, 2010, The European environment — state and outlook 2010, European Environment Agency.
EEA, 2014, ‘Air pollution country fact sheets’ (http://www.eea.europa.eu/themes/air/air-pollution-country-fact-sheets-2014) accessed 22 November 2016.
EEA, 2015, ‘Effects of climate change: Air pollution due to ozone and health impacts (CLIM 006)’ (http://www.eea.europa.eu/data-and-maps/indicators/air-pollution-by-ozone-2/assessment) accessed 10 June 2017.
EEA, 2016, Air quality in Europe — 2016 report, EEA Report No 28/2016, European Environment Agency.
EEA, 2017a, Air quality in Europe — 2017 report, EEA Report No 13/2017, European Environment Agency.
EEA, 2017b, ‘Exceedance of air quality standards in urban areas (CSI 004)’ (http://www.eea.europa.eu/data-and-maps/indicators/exceedance-of-air-quality-limit-3/assessment-3) accessed 21 October 2017.
EEA, 2017c, ‘Air quality e-reporting database’ (http://www.eea.europa.eu/data-and-maps/data/aqereporting-2) accessed 26 June 2017.
EU, 2001, Directive 2001/81/EC of the European Parliament and of the Council of 23 October 2001 on national emission ceilings for certain atmospheric pollutants (OJ L 309, 22.11.2001, p. 22–30).
EU, 2004, Directive 2004/107/EC of the European Parliament and of the Council of 15 December 2004 relating to arsenic, cadmium, mercury, nickel and polycyclic aromatic hydrocarbons in ambient air (OJ L 23, 26.1.2005, p. 3–16).
EU, 2008, Directive 2008/50/EC of the European Parliament and of the Council of 21 May 2008 on ambient air quality and cleaner air for Europe (OJ L 152, 11.6.2008, p. 1–44).
EU, 2011, Commission Implementing Decision 2011/850/EU of 12 December 2011 laying down rules for Directives 2004/107/EC and 2008/50/EC of the European Parliament and of the Council as regards the reciprocal exchange of information and reporting on ambient air (notified under document C(2011) 9068) (OJ L 335/86 , 17.12.2011).
EU, 2013, Decision No 1386/2013/EU of the European Parliament and of the Council of 20 November 2013 on a General Union Environment Action Programme to 2020 ‘Living well, within the limits of our planet’ (OJ L 354, 28.12.2013, p. 171–200).
EU, 2015, Directive (EU) 2015/2193 of the European Parliament and the Council of 25 November 2015 on the limitation of emissions of certain pollutants into the air from medium combustion plants (OJ L 313, 28.11.2015, p. 1–19).
EU, 2016, Directive (EU) 2016/2284 of the European Parliament and of the Council of 14 December 2016 on the reduction of national emissions of certain atmospheric pollutants, amending Directive 2003/35/EC and repealing Directive 2001/81/EC (OJ L 344/1, 17.12.2016).
Eurostat, 2016, Mortality and life expectancy statistics, Eurostat statistics explained (http://ec.europa.eu/eurostat/statistics-explained/index.php/Mortality_and_life_expectancy_statistics) accessed 10 June 2017.
Maas, R., P. Grennfelt (eds), 2016. Towards Cleaner Air. Scientific Assessment Report 2016. EMEP Steering Body and Working Group on Effects on the Convention on Long-Range Transboundary Air Pollution, Oslo. xx+50pp.
WHO, 2006, WHO air quality guidelines for particulate matter, ozone, nitrogen dioxide and sulphur dioxide. Global update 2005, World Health Organization, Regional Office for Europe, Copenhagen.
WHO, 2013, Health risks of air pollution in Europe — HRAPIE project. New emerging risks to health from air pollution — results from the survey of experts, World Health Organization, Regional Office for Europe, Copenhagen.
WHO, 2014, ‘Ambient (outdoor) air quality and health’, Fact sheet No 313, updated March 2014, World Health Organization (http://www.who.int/mediacentre/factsheets/fs313/en/ ) accessed 10 June 2017.

Document Actions
Share with others