|
Indicator
|
EU indicator past trend
|
Selected objective to be met by 2020
|
Indicative outlook
of the EU meeting
the selected
objective by 2020
|
|
Environmental protection expenditure in Europe
|

(% of GDP)
(absolute value at fixed prices)
|
Increase in public and private sector funding for environment- and climate-related expenditure - 7th EAP
|
 |
|
Environmental protection expenditure has increased over the years and this seems likely to continue to 2020, strengthened by the EU's decision that at least 20 % of its 2014–2020 budget should be used on climate change activities
|
For further information on the scoreboard methodology please see Box I.1 in the EEA Environmental indicator report 2016
Setting the Scene
The 7th EAP calls for an increase in both public and private sector environment- and climate-related expenditure to achieve environment and climate objectives (EU, 2013). This briefing presents trends in EPE; promoting activities and technologies aimed at preventing pollution and environmental degradation can reduce the environmental and climate impacts of economic activity. This can also lead to economic development via growth and increasing employment in the environmental goods and services sector (EGSS) (AIRS_PO2.12, 2016).1 However, increased spending can also reflect responses to growing environmental pressures and impacts on the environment.
Policy targets and progress
The 7th EAP Priority Objective 6 identifies the need to increase both public and private sector environment and climate-related expenditure. EPE has grown over the 2003–2013 period by 18 % in real terms, although most of this growth took place before 2008 (Figure 1). The proportions of expenditure of the public sector, industry and specialised producers (a mixture of public and privately run environmental specialist services such as waste and wastewater companies) remained relatively constant over the same period. Specialised producers accounted for half of total expenditure, industry for 20 % and the public sector for 30 %. Expenditure by industry has lagged behind the other two sectors, growing at half the speed.
Overall EPE experienced a dip due to the financial crisis and did not recover to 2008 levels in real terms (fixed prices) until 2011. However, the reduction was mainly driven by industry and specialised providers. Public expenditure actually increased during and immediately following the crisis as governments in EU Member States tried to stabilise their economies by increasing investments, including green investments (Görlach et al., 2014). This increasing trend in EPE in the public sector also protected the EGSS in Europe from the economic downturn (AIRS_PO2.12, 2016).1 However, it should be noted that the main reason for growth in the EGSS was a continuous increase in renewable energy activities, and the EPE indicator does not capture this.
Public expenditure on environment activities as part of policy interventions to stabilise economies also affected the proportion of overall EPE in GDP. This showed a 7 % increase over the 2003–2013 period with a peak in 2009, following 2 years of increased government expenditure (from EUR 85 billion in 2007 to EUR 90 billion in 2009), while the overall economy shrank. Public sector EPE then dropped to EUR 86 billion in 2010 (at 2010 prices), then stagnated after 2009 as the economy began to grow again, reducing the EPE proportion of GDP to 2006 levels by 2013.
Figure 2 shows EPE trends according to environmental domain in the same period. Data are available only for the public sector and specialised producers (approximately 80 % of overall EPE).
Most expenditure was on waste management, followed by wastewater treatment. The growth in EPE has been driven primarily by growth in waste management expenditure. EPE related to air pollution and climate was very limited but this is in part due to industry expenditure not being included in the figures. If this was included, it would add an extra EUR 12 billion EPE in 2013, in addition to the EUR 4 billion spent on air and climate, as shown in Figure 2 (Eurostat, 2015a).
The EPE will only partly capture climate-related expenditure. Nevertheless, given current EU budget allocation commitments and the clear increase in EPE since 2003, it seems unlikely that this trend will be reversed by 2020. Therefore, the prospects for increased environmental expenditure by 2020 appear positive.
Country level information
Figure 3 shows developments at country level in total EPE as percentages of GDP in the 2003–2013 period, where data are available. While trends varied between countries, of the 11 countries with data for all 3 years, eight saw increasing proportions of GDP.
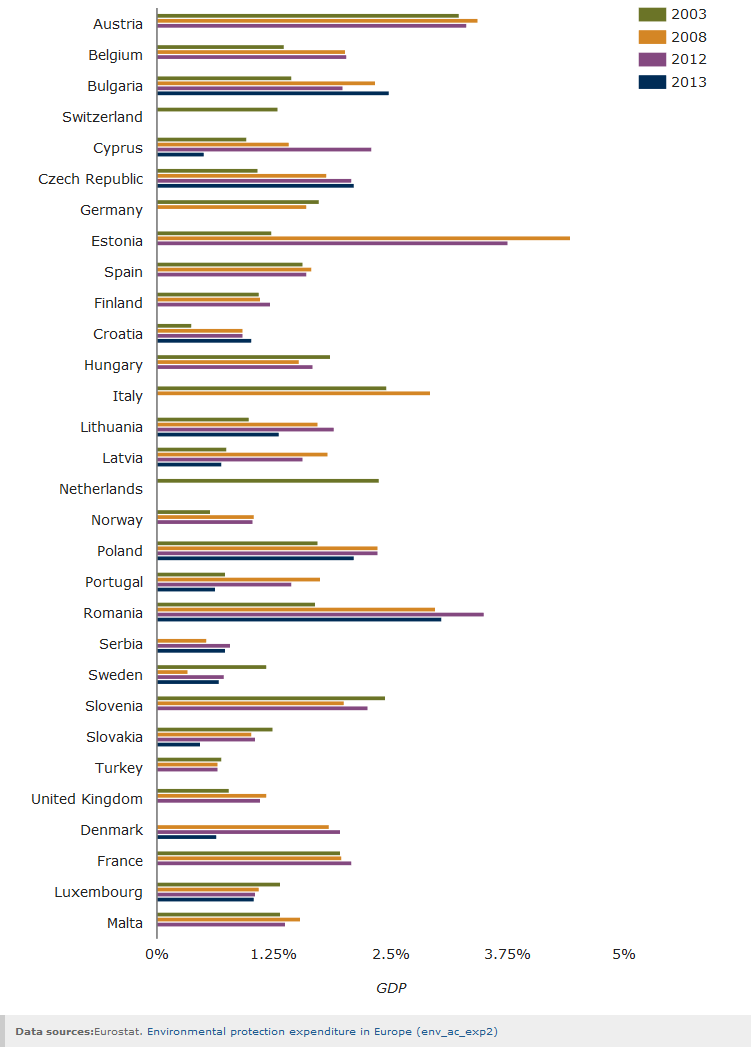
EPE as a proportion of GDP varies strongly across countries. Austria, Estonia, Italy and Romania have proportions over 3 % while Serbia and Turkey have proportions lower than 0.75 % (Figure 3). This wide gap reflects differences in economic structure (e.g. type of industry, type of energy sources used). In most countries, public sector expenditure is concentrated on waste management and wastewater treatment.
The division between EPE current expenditure and investment differs across countries according to the date when they entered the EU. For Member States that have joined the EU since 2004, investment accounts for more than 35 % of total EPE. This expenditure can be explained by the new fixed assets necessary to meet EU water quality and waste management directives.
Outlook beyond 2020
Progress towards a circular economy will require increases in investments and current expenditure in the waste management sector, but also within the business sector as a whole, to close resource loops. The EU intends to invest EUR 5.5 billion of structural funds in accelerating the circular economy (EC, 2015). This could also provide a catalyst for expenditure by the public sector and businesses in Member States up to and beyond 2020.
The EU’s agreed long-term target (EC, 2014) for further reducing greenhouse gas emissions (a 40 % reduction compared with 1990 by 2030) also implies additional investments, not all of which will be captured by the EPE indicator. The air quality targets for 2030 proposed by the European Commission in late 2013 (‘A Clean Air Programme for Europe’; EC, 2013b) could also lead to an increase in EPE beyond 2020. Additional efforts will be needed beyond 2020 to achieve the water quality targets of the Water Framework Directive (EU, 2000) which are also likely to be reflected in an increase in EPE.
About the indicator
This briefing uses data from the environmental protection expenditure account (EPEA), which is one of the European environmental accounts. Environmental accounts analyse the interaction between the economy and the environment by organising environmental information in a way that is consistent with national accounts. EPE illustrates the investments aimed at preventing, reducing and eliminating pollution and environmental degradation. The EPE indicator estimates country spending on these activities in fixed prices (2010 reference year) in euros and as a percentage of GDP.
EPE data are available by environmental domain (protection of ambient air and climate; wastewater management; waste management; protection and remediation of soil, groundwater and surface water; noise and vibration abatement; protection of biodiversity and landscape; protection against radiation; research and development; and other environmental protection activities). EPE data are also available by type of organisation (public, industrial and specialist producers, which can be a mixture of public and privately run environmental specialist services such as waste management companies etc.). EPE can also be split between investments and current (ongoing) expenditure.
European environmental accounts are established by Regulation 691/2011 on European environmental economic accounts. From 2017, reporting of data on the EPEA will be mandatory and standardised. Currently, data on expenditure by certain sectors, particularly industry, is missing in some years for some countries, and in these cases it is estimated by Eurostat. Moreover, industry EPE data broken down by environmental domain are missing.
Although the EPEA includes investment in reducing air pollutants (including greenhouse gases), it does not capture investment in renewable energy, energy efficiency or any form of climate adaptation. Therefore it does not fully capture expenditure to achieve climate policy objectives.

Document Actions
Share with others